3/24/17- Learning objectives
LO 1.16: Core processes like respiration are found in our plants and fish from the aquaponics and control systems. The plants' other core process, photosynthesis, helps it make food for itself. When these first processes were acquired, they were beneficial and therefore made these organisms live on to reproduce
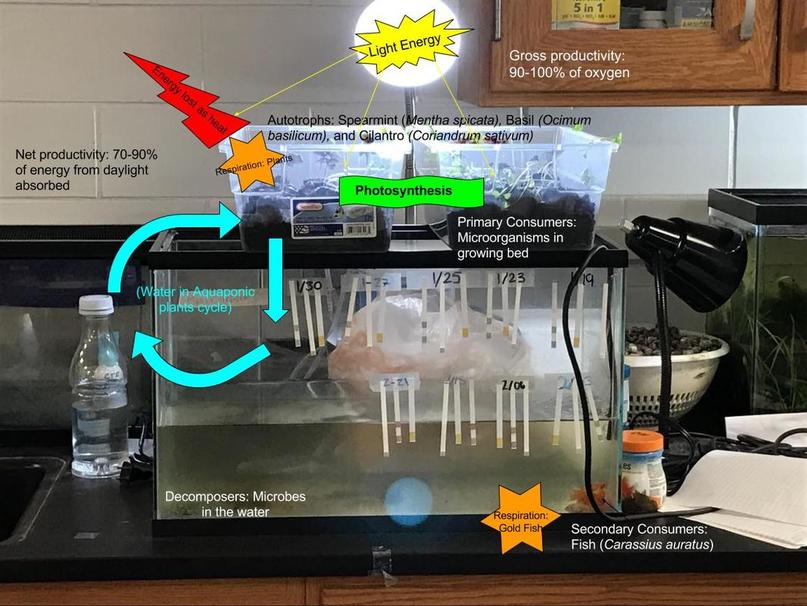
LO 2.41: As you can see in our energy flow chart from our last post, we took our data and demonstrated the flow of energy through photosynthesis, respiration, net/gross productivity, light energy, etc.
LO 3.40: The nitrate/nitrite/ammonia/pH levels in the water demonstrate how the goldfish in our system are responding to external cues (food being given and releasing their urine/feces as a result). Internal changes in the fish is food being stripped from its nutrients and excess being released.
LO 4.11: We are able to identify how our hypothesis will be answered by weekly getting data from our fish tank, plants, and light source. For example, when we measure our plants, we are answering our hypothesis by recording the height of the growth of the two systems of plants to see whether the water used from the aquaponics tank is affecting the growth of our plants.
3/24/17- Science Practices
Practice One:
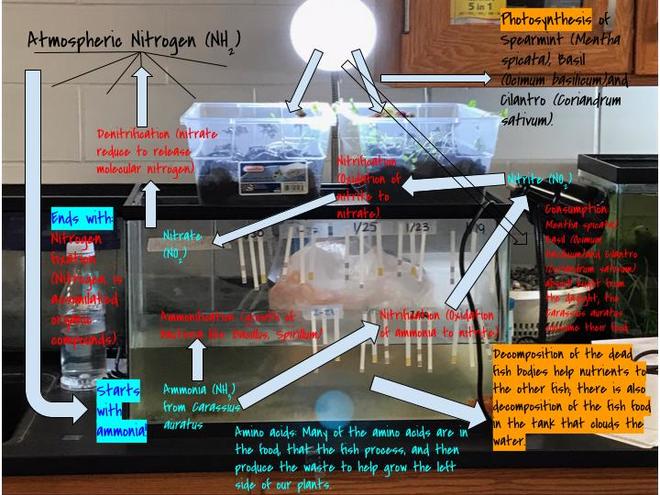
1.1 We created diagrams of the nitrogen cycle and energy flow through our aquaponics system.
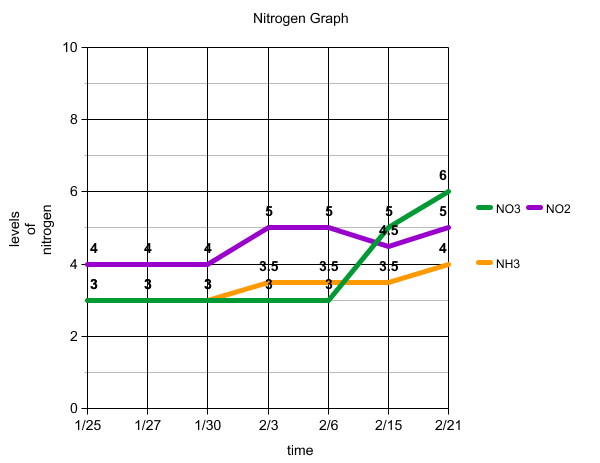
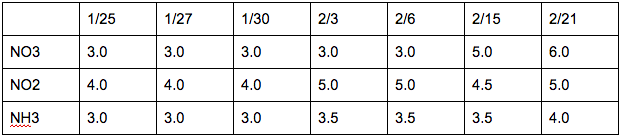
1.2 With the use of graphs, we were able to describe the fluctuation of chemicals like nitrate, nitrite, and ammonia.
1.3 We were able to modify our nitrogen cycle diagrams in our aquaponics system.
1.4 When we found that our ammonia levels were were too high, we replaced some of the water to avoid killing our fish.
1.5 We made a graph, a chart, and a diagram to express our levels and flow of nitrogen through our aquaponics system.
Practice Seven:
7.1 With the use of a chart and a line graph, we expressed how chemicals in the water fluctuated in with time.
7.2 As energy flows through our system, so do chemicals such as ammonia and nitrogen. These go through different forms as they travels from place to place.
1.1 We created diagrams of the nitrogen cycle and energy flow through our aquaponics system.
1.2 With the use of graphs, we were able to describe the fluctuation of chemicals like nitrate, nitrite, and ammonia.
1.3 We were able to modify our nitrogen cycle diagrams in our aquaponics system.
1.4 When we found that our ammonia levels were were too high, we replaced some of the water to avoid killing our fish.
1.5 We made a graph, a chart, and a diagram to express our levels and flow of nitrogen through our aquaponics system.
Practice Seven:
7.1 With the use of a chart and a line graph, we expressed how chemicals in the water fluctuated in with time.
7.2 As energy flows through our system, so do chemicals such as ammonia and nitrogen. These go through different forms as they travels from place to place.
The updated nitrogen cycle:
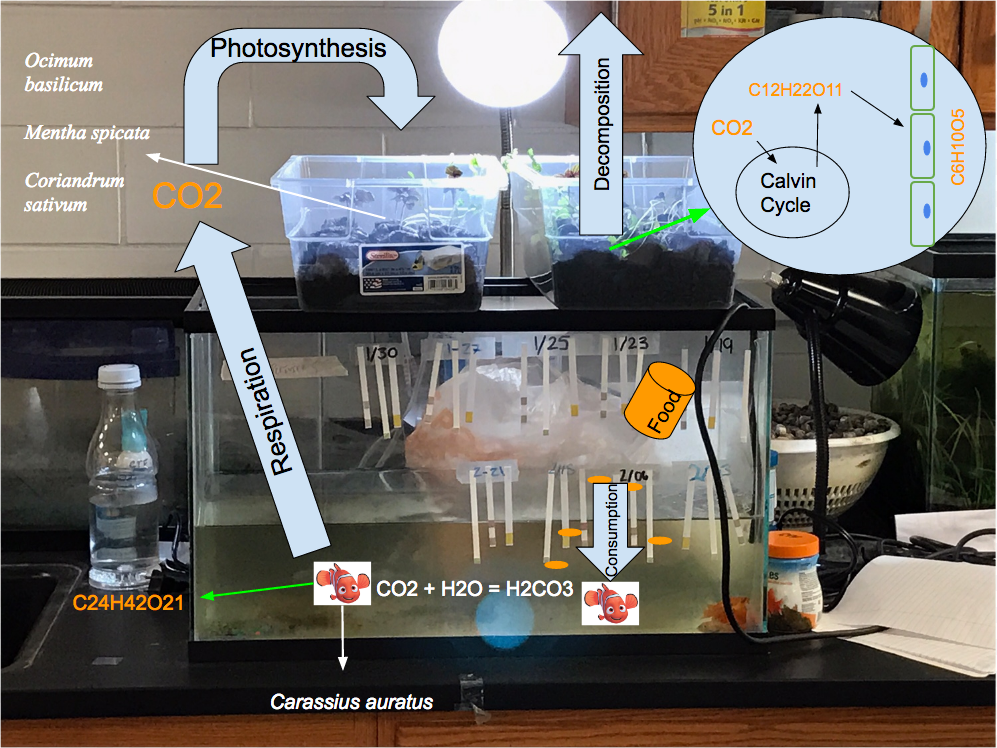
Our Carbon cycle:
OUr energy flow: